After a tumultuous year in the banking sector, the demand for lower middle market specialty finance capital continues to increase and Revere’s pipeline has never been more robust. Revere believes the current environment is a once in a generation opportunity to generate high, uncorrelated current cash yields with a compelling risk profile.
Consumer Credit Resiliency
The media has focused recently on the financial health of the US household. They have been emphasizing (i) household debt has reached record levels, and (ii) in certain sectors, delinquencies are back to pre-pandemic levels or higher. The conclusion being that the consumer is running out of resources and the economy will suffer.
A deeper look at the data reveal some interesting facts:
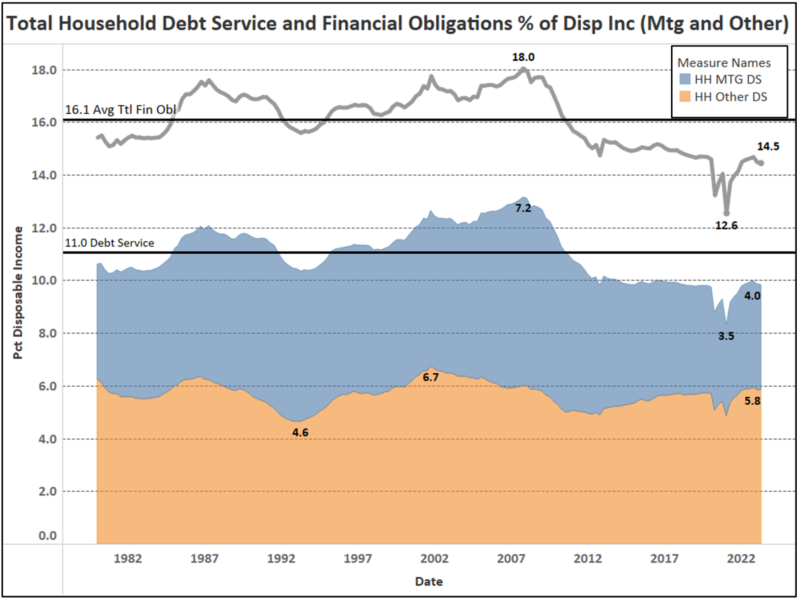
- Chart 1 indicates that household debt service and total household financial obligations as a percentage of disposable income are at 40-year lows (excluding the 2020-2021 pandemic quarters).
- Over the past 10 years, consumers have restructured their balance sheets with inexpensive, fixed-rate mortgage debt. Almost 80% of the consumer debt burden is mortgage loans (70.2%) and auto loans (9.2%), both of which are primarily fixed-rate liabilities.
- As a percentage of disposable income, debt service related to mortgage debt is almost 45% lower than at the end of 2007.
- Consumer debt is rising at a slower pace than inflation over the past 3+ years
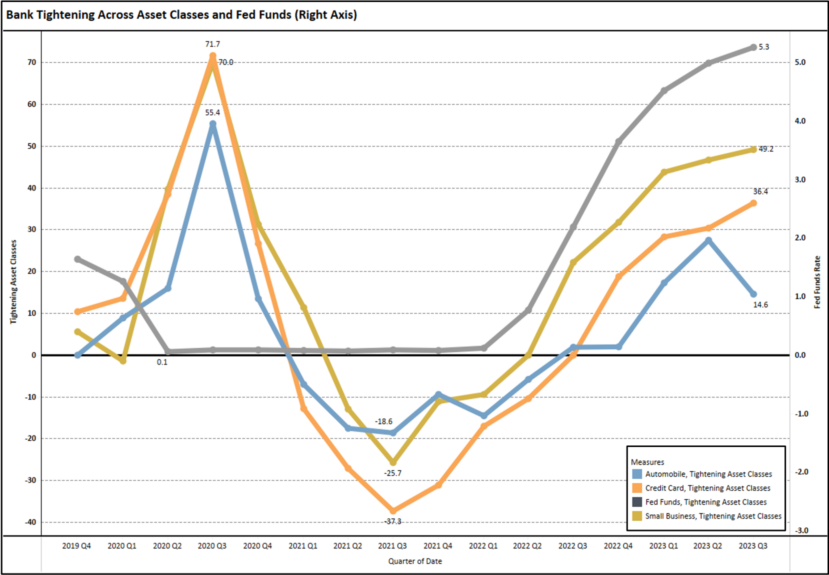
- Credit card portfolios specifically have returned to or exceeded their 4Q2019 pre-pandemic levels. Chart 2 displays (i) the percentage of US credit card banks either tightening credit standards (>0) or loosening standards (<0), and (b) percentage of US credit card balances that are 90+ delinquent. Excluding the GFC and prior to 2020, credit card lenders managed their portfolios with typically minor adjustments to credit standards.
- The GFC and the pandemic that led to extreme tightening of credit standards. However, the recent jump in credit card rates can be traced back to the unprecedented loosening of credit in 2021 and early 2022. A deeper look at the data indicates that, while all age groups are increasing, the 18-29 and 30-39 borrowers are increasing at a faster rate. Many of these could be first time credit card borrowers or new 2nd or 3rd card borrowers that invariably carry a higher risk and it will be another 1-2 quarters of increases before the current tightening of credit standards (or reduction in marketing efforts) take effect.
Chart 1

Chart 2

Small Business Resiliency
Financial media has consistently used automobile loan performance as sign that the consumer is over-stressed financially, but a few things to keep in mind:
- Automobile lending results are not as responsive as credit card debt to changes in credit standards due to the duration of the loans. Auto finance is also complicated by the captive finance companies that are willing to subsidize loan rates and loan terms in or to sell or lease autos. This will, in turn, pressure other lenders to adjust terms over time rather than in a one or two quarter period. As a result, changes in underwriting can take 12-months or more to impact portfolio performance.
- Chart 3 displays the same delinquency and loan availability information for auto loans. Unfortunately, the data shown only goes back for a 12-year period, but it (like the credit card data) highlights two very important events (i) the near shut-down of the market in 2020 due to the pandemic and (ii) the steep tightening of standards due to the 1st and 2nd quarter SVB-fueled banking crisis. Note that 90+ delinquency during 2023 has been little changed and yet lenders tightened credit more than any non-pandemic period in the prior 12-years
- Auto lending does have its issues, but these are mainly related the result of (i) automobile affordability in general, (ii) loosening standards in 2021 when auto values were inflated due to lack of supply (an LTV issue), and (iii) difficulty with credit models coming out of the pandemic as government payments to individuals clouded the ability to distinguish credit in certain cases.
Chart 4 reflects the delinquency and availability of loans to small businesses, which shows the same general pattern as auto lending and, to a certain extent, credit card lending.
- Up until early 2022 asset performance generally dictated the availability of credit.
- What makes this period so unusual is that banks are tightening credit when their portfolios are, in general, performing.
Chart 3

Chart 4

Federal Reserve Rate Increases – Before and After – Corporate
Chart 5 represents a very simple example of the interest rate impact on corporate financial results. The example is a company with $75MM of EBITDA last week that raises senior debt at a multiple of 6x EBITDA or $450MM.
- In 2021 the company had $100MM of revenue, the $75MM EBITDA mentioned above, interest expense of $31MM and a fixed-charge coverage ratio of just over 2-to-1.
- All else being equal, in 2023, that same company would have seen its interest expense increase by 60%, income drop by almost 60% and the fixed-charge coverage ratio drop to 1.3x.
- Additionally, with lending multiples tightening to 4x, the company’s EBITDA would have to increase by more than 50% in order for the company to borrow additional senior capital or refinance a maturing facility.
- This has created 2nd lien and mezzanine opportunities for investors, but these opportunities all depend on multiple expansion and refinance or an M+A takeout for realization.
Specialty Finance investing does not focus on multiples of expected cash flow, it focuses on the value of existing assets, with the value generally being a discount of 10% to 30% of face value and 30% to 60% of expected cash return.
- The SOFR rate increase obviously impacts Specialty Lending Companies, however, the duration of the assets supporting the Specialty Finance Loans is generally 6-12 months, allowing our borrowers to adjust pricing as rates increase.
- Where our borrowers do not have the ability to increase pricing, they will adjust their product mix in order to maintain compliance with facility covenant.
- In the event that compliance is not maintained, Specialty Finance Lenders have the ability to stop funding and repay the investment with the proceeds from the existing assets.
Chart 5

Why Now?
1.The Federal Reserve
- Over the past two years the Federal Reserve embarked on an unprecedented series of rate increases that put a high degree of stress on business models that were thriving in the cheap money environments.
- This has led to a pruning of poorly capitalized businesses and business models.
- After increasing the Fed Funds rate by 500 basis points in less than two years, the Fed has paused over the last two meetings. While future increases are not off the table, the lion’s share of the work has been done without bludgeoning the economy.
2. Banks
- In the past two years the bank market has fundamentally change, first by rate increases leading to Silicon Valley Bank’s collapse and then by the government prescribed “cure”. More regulation and more capital required results in less lending and more simple lending.
- Whether you believe this is good or bad, the ultimate result is that more and more specialty lending will move to the private markets. Our existing borrowers and prospects are seeing this outcome every day in the quality of the applications they review.
3. Pipeline
- Revere Specialty Finance is seeing this in real time as the breadth and quality of our pipeline has never been greater as we are seeing opportunities that would have migrated to lower cost bank lenders just months ago.
4. Revere Platform
- Revere Specialty Finance is led by professionals that have managed capital across multiple cycles and events.
- Revere had proven able to manage through significant macro headwinds, like Covid and unprecedented interest rate hikes with no losses.
Chart 6

Where Does an Investment in Revere Specialty Finance fit within an investment program?
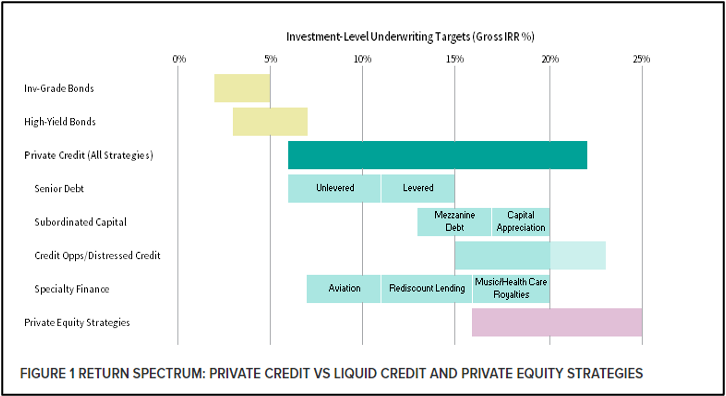
As highlighted in Chart 7, Specialty Finance falls firmly within the increasingly important Private Credit Strategies. More specifically, Revere Specialty Finance focuses on “Rediscount Lending” as set forth in the chart with some notable exceptions:
- Revere’s niche of lower middle market Rediscount Lending focuses on opportunities in the $5MM to $50MM space that benefits from (i) the complexity premium that most participants in the sector earn, and (ii) a premium that Revere earns by providing the leverage for expansion which enables smaller borrowers to achieve operational scale.
- As a result, our underwriting returns target tends to be at the higher end of the scale.
- Additionally, the Revere Specialty Finance Fund also brings the ability to take advantage of portfolio purchase opportunities, distressed investments and direct lending opportunities.
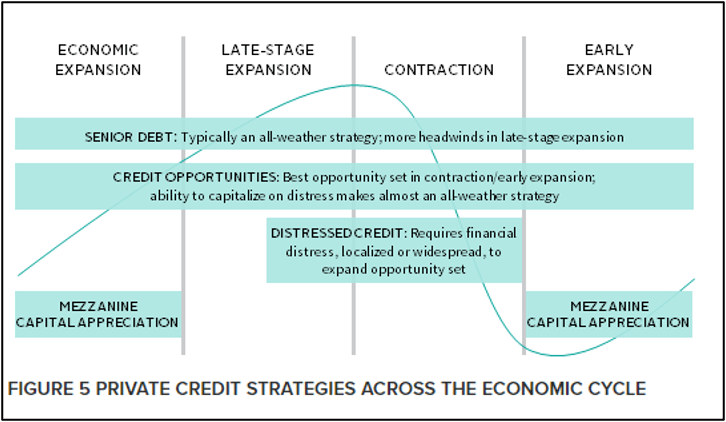
Chart 8 underscores the relative benefits of investing in the most senior part of the capital structure within the credit cycle.
- Revere Specialty Finance has historically provided capital on a senior and secured basis.
- Senior lending in Specialty Finance benefits from significant covenants, cash control accounts and the ability to control outcomes in the event of a default.
Chart 7

Chart 8

Data Sources
Chart Number References:
- Household Debt Service Payments as a Percent of Disposable Personal Income – Board of Governors of the Federal Reserve System (US), Household Debt Service Payments as a Percent of Disposable Personal Income [TDSP], retrieved from FRED, Federal Reserve Bank of St. Louis; https://fred.stlouisfed.org/series/TDSP, Q3 2023.
- Board of Governors of the Federal Reserve System (US), Delinquency Rate on Business Loans, All Commercial Banks [DRBLACBS], retrieved from FRED, Federal Reserve Bank of St. Louis; https://fred.stlouisfed.org/series/DRBLACBS, Q3 2023 and Board of Governors of the Federal Reserve System (US), Net Percentage of Domestic Banks Tightening Standards for Commercial and Industrial Loans to Small Firms [DRTSCIS], retrieved from FRED, Federal Reserve Bank of St. Louis; https://fred.stlouisfed.org/series/DRTSCIS, Q3 2023.
- Board of Governors of the Federal Reserve System (US), Net Percentage of Domestic Banks Tightening Standards for Auto Loans [STDSAUTO], retrieved from FRED, Federal Reserve Bank of St. Louis; https://fred.stlouisfed.org/series/STDSAUTO, Q3 2023 and Board of Governors of the Federal Reserve System (US), Delinquency Rate on Consumer Loans, All Commercial Banks [DRCLACBS], retrieved from FRED, Federal Reserve Bank of St. Louis; https://fred.stlouisfed.org/series/DRCLACBS, Q3 2023.
- Board of Governors of the Federal Reserve System (US), Delinquency Rate on Credit Card Loans, All Commercial Banks [DRCCLACBS], retrieved from FRED, Federal Reserve Bank of St. Louis; https://fred.stlouisfed.org/series/DRCCLACBS, Q3 2023. and Board of Governors of the Federal Reserve System (US), Net Percentage of Domestic Banks Tightening Standards for Credit Card Loans [DRTSCLCC], retrieved from FRED, Federal Reserve Bank of St. Louis; https://fred.stlouisfed.org/series/DRTSCLCC, Q3 2023.
- Board of Governors of the Federal Reserve System (US), Federal
